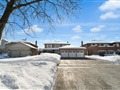
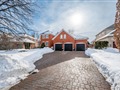
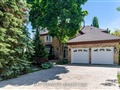
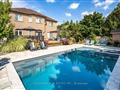
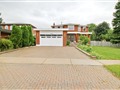
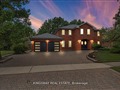
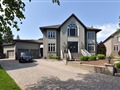
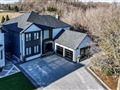
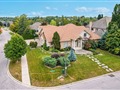
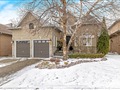
117 Gregory Scott Dr
$2,940,855
Comparative Market Analysis
Jun 29, 2025
NOT AN ACTIVE LISTING
Historical Performance
| Period | $ Change | % Change |
| 1 Day | +$635 | +0.022% |
| 7 Days | -$352 | -0.012% |
| 30 Days | -$7,644 | -0.259% |
| 3 Months | -$13.3k | -0.451% |
| 6 Months | +$41.6k | +1.43% |
| 1 Year | -$153k | -4.93% |
| 3 Years | +$399k | +15.7% |
| 5 Years | +$635k | +27.5% |
| 10 Years | +$1.42m | +93.0% |
List My Property
Real Estate Statistics
Financing Solutions
Browsing History
26 Islington Woods Crt, Vaughan
0 second ago
87 Wakelin Crt, Vaughan
1 second ago
48 Gregory Scott Dr, Vaughan
1 second ago
104 Mccabe Cres, Vaughan
1 second ago
55 Squire Graham Lane, Vaughan
2 seconds ago
40 Ayton Cres, Vaughan
2 seconds ago
AS SEEN ON


Are You a Licensed Real Estate Agent or Broker?