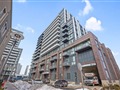
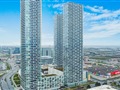
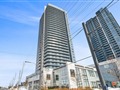
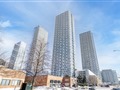
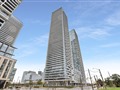
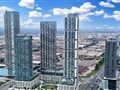
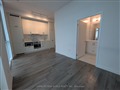
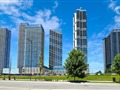
175 Millway Ave 5012
$535,969
Comparative Market Analysis
May 13, 2025
NOT AN ACTIVE LISTING
Historical Performance
| Period | $ Change | % Change |
| 1 Day | +$354 | +0.066% |
| 7 Days | +$241 | +0.045% |
| 30 Days | +$102 | +0.019% |
| 3 Months | -$1,521 | -0.283% |
| 6 Months | +$5,194 | +0.979% |
| 1 Year | -$28.8k | -5.10% |
| 3 Years | +$62.5k | +13.2% |
| 5 Years | +$132k | +32.6% |
| 10 Years | +$285k | +114% |
List My Property
Real Estate Statistics
Financing Solutions
Browsing History
75 North Park Rd LPH19, Vaughan
2 seconds ago
12 Woodland Acres Cres, Vaughan
2 seconds ago
AS SEEN ON


Are You a Licensed Real Estate Agent or Broker?