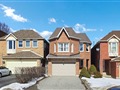
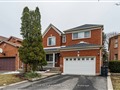
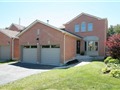
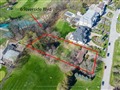
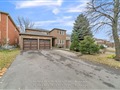
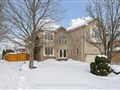
41 Thornbank Rd
$5,519,847
Comparative Market Analysis
Jun 22, 2025
NOT AN ACTIVE LISTING
Historical Performance
| Period | $ Change | % Change |
| 1 Day | +$1,129 | +0.020% |
| 7 Days | +$2,356 | +0.043% |
| 30 Days | +$1,514 | +0.027% |
| 3 Months | +$31.4k | +0.573% |
| 6 Months | +$207k | +3.90% |
| 1 Year | +$49.7k | +0.908% |
| 3 Years | +$1.60m | +40.8% |
| 5 Years | +$1.84m | +49.8% |
| 10 Years | +$3.18m | +136% |
List My Property
Real Estate Statistics
Financing Solutions
AS SEEN ON


Are You a Licensed Real Estate Agent or Broker?