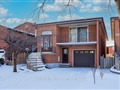
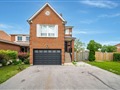
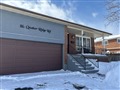
47 Bob O'link Ave
$1,112,112
Comparative Market Analysis
Jul 1, 2025
NOT AN ACTIVE LISTING
Historical Performance
| Period | $ Change | % Change |
| 1 Day | +$282 | +0.025% |
| 7 Days | +$60 | +0.005% |
| 30 Days | -$2,347 | -0.211% |
| 3 Months | -$3,964 | -0.355% |
| 6 Months | +$17.3k | +1.58% |
| 1 Year | -$54.6k | -4.68% |
| 3 Years | +$189k | +20.4% |
| 5 Years | +$313k | +39.2% |
| 10 Years | +$634k | +133% |
List My Property
Real Estate Statistics
Financing Solutions
Browsing History
43 Jason St, Vaughan
5 seconds ago
AS SEEN ON


Are You a Licensed Real Estate Agent or Broker?