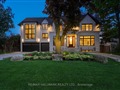
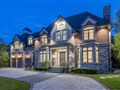
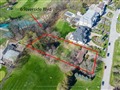
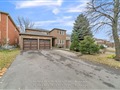
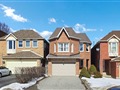
53 Thornbank Rd
$6,597,969
Comparative Market Analysis
May 31, 2025
NOT AN ACTIVE LISTING
Historical Performance
| Period | $ Change | % Change |
| 1 Day | +$1,349 | +0.020% |
| 7 Days | -$1,042 | -0.016% |
| 30 Days | -$17.6k | -0.267% |
| 3 Months | -$30.2k | -0.456% |
| 6 Months | +$93.7k | +1.44% |
| 1 Year | -$352k | -5.07% |
| 3 Years | +$630k | +10.6% |
| 5 Years | +$1.01m | +18.0% |
| 10 Years | +$3.05m | +86.0% |
List My Property
Real Estate Statistics
Financing Solutions
Browsing History
30 North Park Rd 1209, Vaughan
1 second ago
30 North Park Rd 1006, Vaughan
2 seconds ago
85 North Park Rd 1104, Vaughan
3 seconds ago
30 North Park Rd 1510, Vaughan
4 seconds ago
30 North Park Rd 421, Vaughan
5 seconds ago
20 North Park Rd 407, Vaughan
6 seconds ago
85 North Park Rd 1202, Vaughan
7 seconds ago
85 North Park Rd PH01, Vaughan
8 seconds ago
47 Poetry Dr, Vaughan
9 seconds ago
160 Markwood Lane, Vaughan
10 seconds ago
AS SEEN ON

Are You a Licensed Real Estate Agent or Broker?