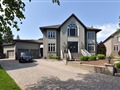
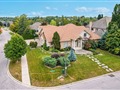
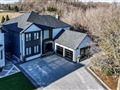
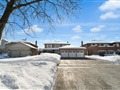
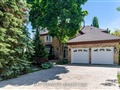
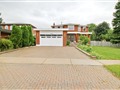
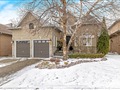
63 Humberview Dr
$3,426,462
Comparative Market Analysis
Jun 29, 2025
NOT AN ACTIVE LISTING
Historical Performance
| Period | $ Change | % Change |
| 1 Day | +$740 | +0.022% |
| 7 Days | -$410 | -0.012% |
| 30 Days | -$8,906 | -0.259% |
| 3 Months | -$15.5k | -0.451% |
| 6 Months | +$48.4k | +1.43% |
| 1 Year | -$183k | -5.06% |
| 3 Years | +$438k | +14.7% |
| 5 Years | +$760k | +28.5% |
| 10 Years | +$1.59m | +86.5% |
List My Property
Real Estate Statistics
Financing Solutions
AS SEEN ON


Are You a Licensed Real Estate Agent or Broker?