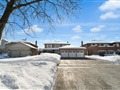
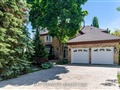
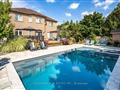
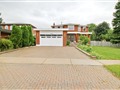
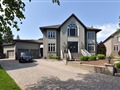
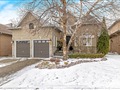
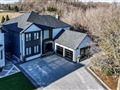
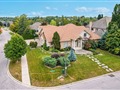
72 Gregory Scott Dr
$2,482,000
Comparative Market Analysis
Jun 29, 2025
NOT AN ACTIVE LISTING
Historical Performance
| Period | $ Change | % Change |
| 1 Day | +$536 | +0.022% |
| 7 Days | +$67 | +0.003% |
| 30 Days | -$4,667 | -0.188% |
| 3 Months | -$5,440 | -0.219% |
| 6 Months | +$47.1k | +1.93% |
| 1 Year | -$104k | -4.03% |
| 3 Years | +$413k | +20.0% |
| 5 Years | +$723k | +41.1% |
| 10 Years | +$1.49m | +151% |
List My Property
Real Estate Statistics
Financing Solutions
Browsing History
56 Arista Gate, Vaughan
1 second ago
54 Carstad Cres, Vaughan
1 second ago
AS SEEN ON


Are You a Licensed Real Estate Agent or Broker?